Enter Measured Results
Use one consistent protocol and home setup so this score becomes useful for repeat tracking, not just a one-off estimate.
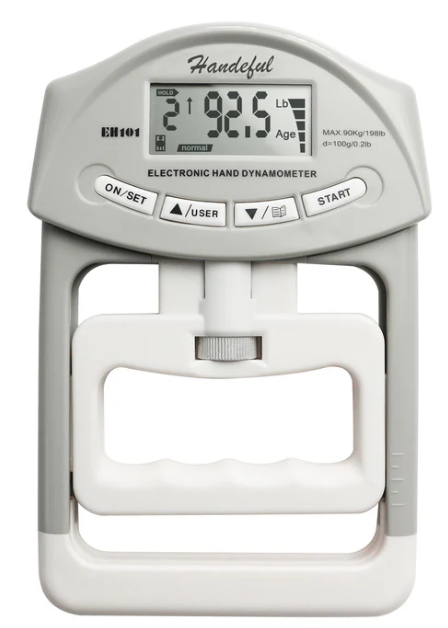
Handeful digital dynamometer
If you are using the grip-strength version of this calculator, a simple standardized option is the Handeful Grip Strength Tester. It fits the workflow on the validation page and makes repeated home or clinic measurements easier to keep consistent.
How to measure grip strength
Watch the narrated guide before testing. English captions, written steps and study links are included.
Use a hand dynamometer, a consistent seated position, and three trials per hand. Enter your best dominant-hand result in pounds; the other hand is optional.
Written steps, transcript and official sources
- Prepare the device and yourself
Use a hand dynamometer, not a pinch gauge or a spring exercise gripper. Follow its instructions for checking calibration, choosing a comfortable handle setting, and resetting the display. Use the same device and setting at future visits. This page asks for pounds. If possible, select pounds on the device before testing.
- Set your seated position
Sit upright with your back supported and feet flat. Keep your shoulder relaxed and upper arm beside your body. Bend your elbow about ninety degrees. Hold your forearm in a handshake position and keep your wrist close to neutral. Do not rest the testing arm or device on the chair, your thigh, or a table.
- Learn the squeeze
Try one gentle practice squeeze if you need to learn the device. Then reset it. For a recorded trial, squeeze as hard as you safely can for about three seconds, then relax. Keep the same posture and breathe normally. Do not jerk the device, lean your body into it, or hold a prolonged endurance squeeze.
- Record three trials per hand
Record three trials for each hand you test, resetting the device between trials. This page uses fifteen to thirty seconds of rest between attempts. That is a tracking convention, not a universal research standard. Longer rest can reduce fatigue effects. If you need more recovery, take it, record the interval, and use the same method at future visits. Do not keep squeezing repeatedly to chase a better result.
- Enter the correct hand and unit
Your dominant hand is your usual preferred hand, not whichever hand scores higher today. Enter its highest trial in Dominant hand grip strength, in pounds. You may enter the other hand's highest trial in the optional non-dominant field. This page uses the best trial. Do not substitute the average or add the two hands together. Some studies use an average, so keep that distinction clear.
- Check, document and stop safely
Replace preset values with your actual readings. Note the device, handle setting, posture, rest interval, and all trials in Measurement context. If your device reports kilograms of force, convert to pounds by multiplying by about two point two zero five and note the conversion. Stop for pain or concerning symptoms. Ask your clinician first after hand injury or surgery, or if physical activity makes your symptoms worse later. These grip studies do not validate the combined score on this page.
Protocol and evidence limits: Mito Map uses the best dominant-hand trial. Some published protocols use the mean of three; these are different summary measures. The 15–30 second rest interval is this page's tracking convention, not a universal optimum. Longer rest may be needed; document it and keep future visits consistent. These studies do not validate the Mito Map composite or diagnose the cause of weakness.
Official sources and studies
- Mathiowetz et al. (1984): reliability and validity of grip testing
- K-force/Jamar study (2023): seated posture, three trials and rest
- Kurosaki (2019): rest intervals and best versus mean results
- Kurosaki and Momose (2019): fatigue across repeated grip trials
- NICE NG206: delayed post-exertional symptom worsening
How to do the five-rise chair test
Watch the narrated guide before testing. English captions, written steps and study links are included.
Start seated. On “Go,” rise five times as quickly and safely as possible. For this page's standing-finish protocol, stop the timer when fully upright on the fifth rise.
Written steps, transcript and official sources
- Prepare a stable chair and timer
Choose a firm chair with no wheels. Its seat should be about seventeen to eighteen inches high. Place it on a non-slip surface and make sure it cannot slide or tip. Clear the floor and wear secure footwear. Have a timer and, when needed, a helper ready. Use the same chair height and setup each visit.
- Check that testing is safe
Record baseline fatigue before performance testing. Start seated with your back against the chair and feet flat. For the standard test, fold your arms across your chest. If appropriate, try one untimed rise to check that you can stand safely without your hands, then recover before timing. If you cannot, or feel unsafe, do not force the unsupported test. Ask your clinician about a safe alternative.
- Start the clock on Go
Start seated again. The helper starts the timer on the word Go, not after you are already standing. Stand fully upright with hips and knees straight, then sit back down under control. Repeat at a pace that is as quick as safely possible. Keep your feet and arm position consistent. Do not bounce off the seat or use your hands during the standard unsupported test.
- Stop at the FIFTH full stand
Count each complete rise: one, two, three, four, five. For the standing-finish protocol used on this page, stop the timer when you are fully upright on the fifth rise. This matches the National Institute on Aging chair-stand instructions reproduced in the linked research toolkit. Another five-times test ends after the fifth return to sitting. Those times are different. Do not mix the two finish rules.
- Record time and support honestly
Enter elapsed seconds in the five times sit to stand field, including any pauses while the clock was running. If you used your hands, the standard unsupported test was not completed. Only use a supported adaptation if it is safe and appropriate for you. Mito Map lets you record light or repeated hand support; choose what actually happened and describe it. Do not label a supported result as standard, and do not invent a time for an incomplete test.
- Rate fatigue; stop when needed
Immediately after completion, record current fatigue from one, no fatigue, to seven, maximal fatigue in the post-test field. This is an adapted single rating, not the nine-item FSS. Stop testing for pain, dizziness, chest discomfort, concerning breathlessness, or loss of balance. The official chair-stand protocol also stops if five rises are not completed within one minute. Ask your clinician before testing if exertion triggers symptom crashes. Note chair height, finish rule, support, and unusual conditions. Record delayed worsening separately. These research protocols do not validate Mito Map's combined score.
Protocol and evidence limits: This page uses the PhenX/NIA standing-finish convention: stop at the fifth full stand. ANPT's five-times sit-to-stand guide ends at the fifth return to sitting. Record the finish convention; do not interchange times. Hand-supported testing is a modified Mito Map option, not a successful standard unsupported test. Published performance-test evidence does not validate the Mito Map composite.
Official sources and studies
How to record your fatigue scores
Enter the original FSS mean for baseline fatigue. The immediate post-test rating is a separate measure.
Both fatigue fields use 1–7. Baseline is the mean of nine past-week FSS items. Immediate post-test fatigue is an adapted single rating, from 1 (none) to 7 (maximal). Enter values directly; conversion is handled internally. Do not subtract the ratings.
Written steps, transcript and study sources
- Before performance testing, complete all nine FSS items about the past week. Each uses 1 = completely disagree and 7 = completely agree.
- Add all nine answers and divide by 9. Enter the mean directly in the baseline FSS field (1–7). For example, a total of 36 gives a mean of 4; enter 4. Do not enter the total or convert to 0–10.
- Only perform a safe, appropriate chair test. Immediately after completion, enter current fatigue from 1 (none) to 7 (maximal) in the post-test field. This adapted single rating shares the FSS numeric range, but is not the nine-item FSS.
- Use actual questionnaire and test results. Record unusual conditions and delayed symptom worsening separately.
Evidence limits: Published FSS studies do not validate the immediate post-test rating or the Mito Map combined score. Previously saved fatigue values remain preserved; displaying them on the FSS range does not establish that the nine-item questionnaire was completed.
Study sources and guidance
- Krupp et al. (1989), original Fatigue Severity Scale study
- Rosti-Otajarvi et al. (2017), FSS reliability and scoring
- American Thoracic Society, fatigue measures and recall periods
- NICE NG206: delayed post-exertional malaise
Video transcript
1. Baseline uses the original FSS scale
For baseline fatigue, use the original Fatigue Severity Scale. Complete all nine items about the past week before performance testing. Rate each statement from one, completely disagree, to seven, completely agree. Higher scores represent greater fatigue impact. Enter your questionnaire mean directly on this page.
2. Calculate the mean, not the total
Add your nine answers, then divide by nine. For example, a total of thirty-six divided by nine gives a mean of four. Enter four in the baseline FSS field. Do not enter the sum, and do not convert the mean to a zero to ten number. If answers are missing, complete the form or ask your clinician how to handle them.
3. Keep baseline separate from the test
Baseline describes fatigue and its effects over the past week. Do not replace it with how tired you feel immediately after grip or chair testing. Use the same questionnaire and recall period at future visits. Replace estimated values with your actual result. An older saved value displayed on the new range does not prove that the questionnaire was completed.
4. Immediate fatigue is a separate rating
Only complete a chair test that is appropriate and safe for you. Immediately afterward, rate your current fatigue from one, no fatigue, to seven, maximal fatigue. Enter that absolute rating in the post-test field. This adapted single rating uses the same numeric range as the FSS, but it is not the nine-item past-week questionnaire. Do not subtract baseline, and do not substitute pain or breathlessness for fatigue.
5. Check and document both entries
Both fatigue fields now use one to seven. Baseline takes the mean of your nine past-week FSS answers. The post-test field takes an adapted rating of fatigue right now. Enter the values directly; the app handles conversion internally. Note your questionnaire result and unusual conditions in Measurement context. Record later symptom worsening separately, because an immediate rating cannot capture a delayed change.
Repeat consistently and safely
Stop performance testing if you feel unsafe or develop concerning symptoms. Ask your clinician before testing if physical activity makes symptoms worse later. Published FSS studies support the questionnaire in studied populations. They do not validate the immediate post-test rating or this app's combined function score. Study links and written instructions are below the video.
This calculator now uses raw grip strength in pounds.
The dominant hand is required for the grip protocol. The non-dominant hand is optional and adjusts the grip component for bilateral symmetry.
If both hands score the same, the grip component is slightly higher than a single-hand entry at that same level. As the two hands drift further apart, the grip component falls monotonically, and a large mismatch scores worse than entering only the dominant hand.
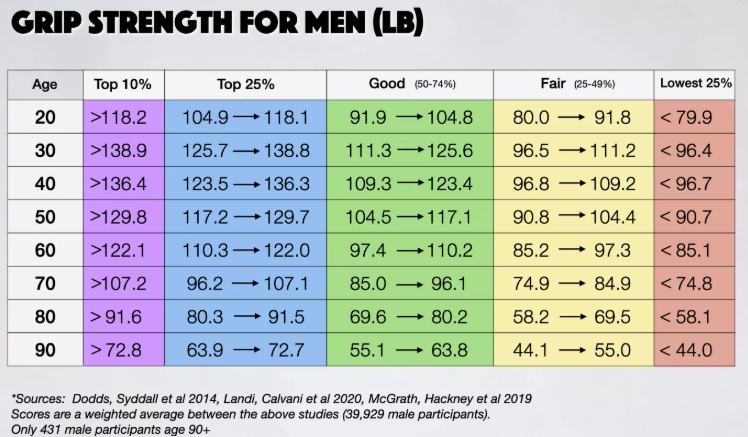
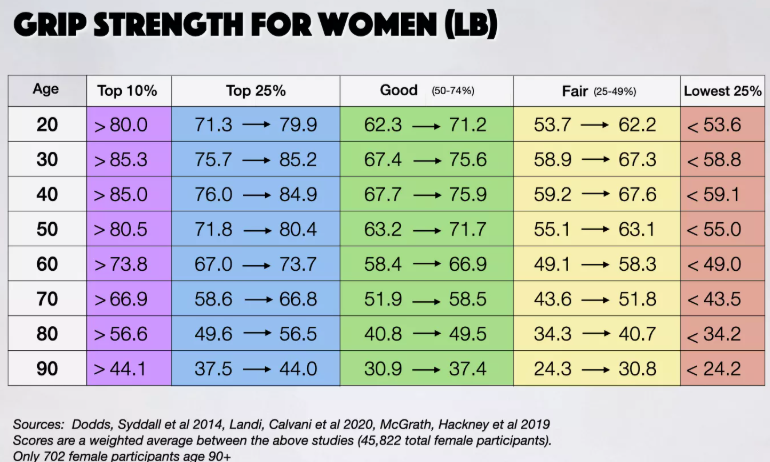
For practical interpretation, it anchors "low strength" near common sex-specific cut points used in the literature:
women around `35-40 lbs`, men around `60-65 lbs`.
Both grip and sit-to-stand now use asymptotic scoring with sex-specific scales. Male grip scaling uses a higher ceiling than female grip scaling, and sit-to-stand uses sex-specific top benchmarks and floor values.
Both fatigue fields use 1 to 7. Baseline is the original FSS mean; immediate post-test fatigue is an adapted single rating, not an FSS score. Conversion for the existing scoring system is handled internally.
Measured Physical Function
This is the observed-function companion to the Energy Score. It emphasizes practical repeatability over perfect clinical exhaustiveness.